
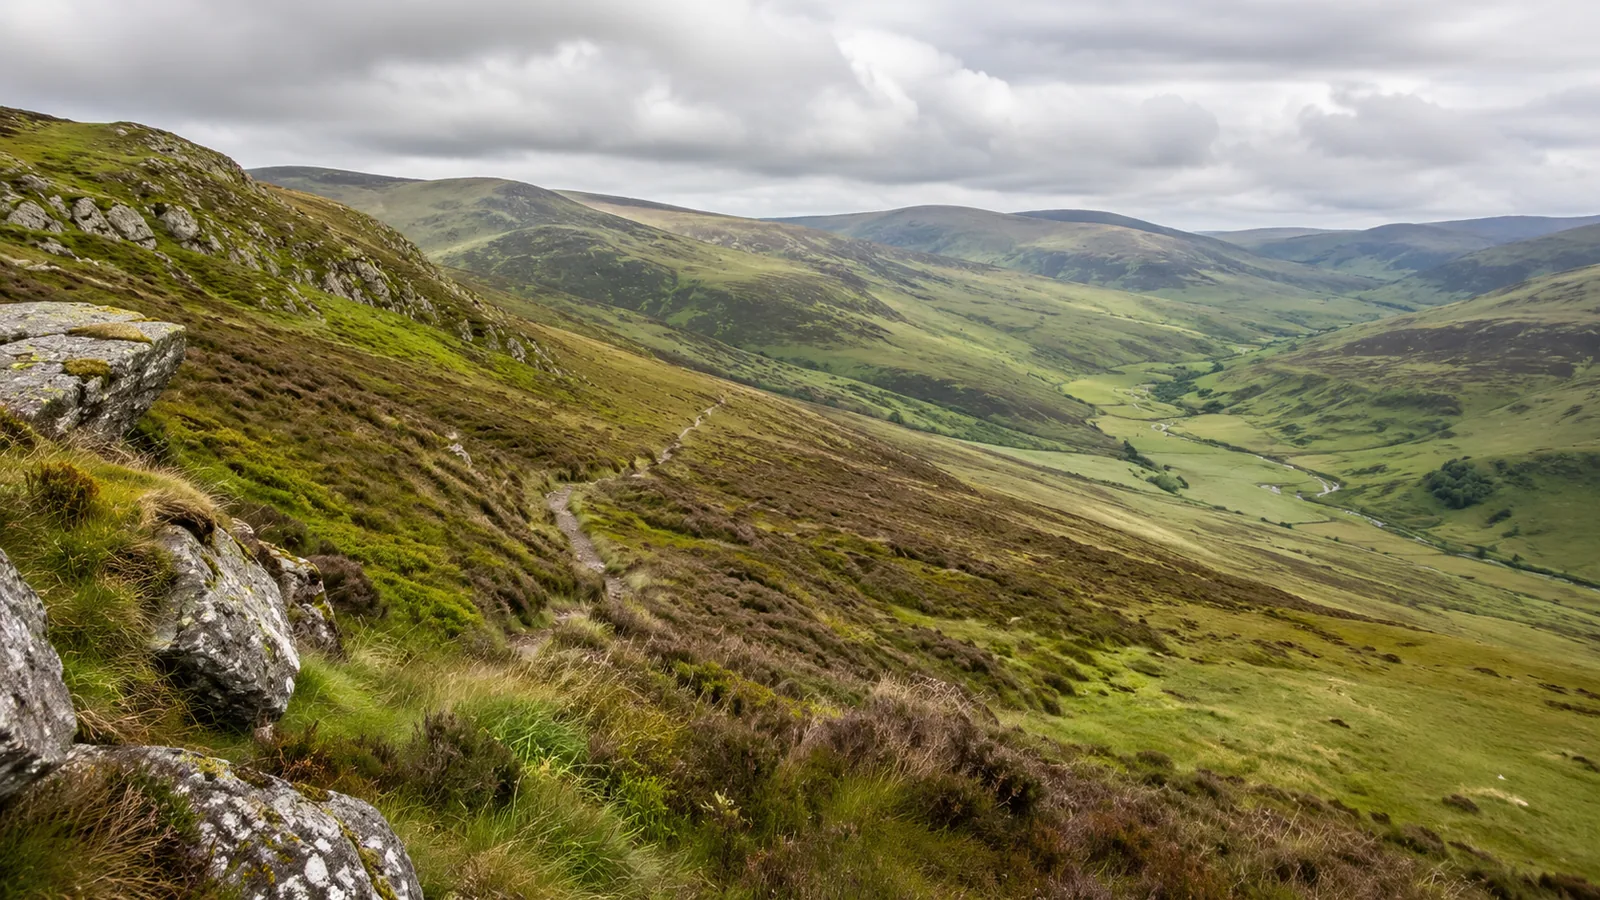
A line on a walking map can cross half a hillside without the walker gaining any height. Another line, drawn through the same patch of ink, can climb hard for most of its length. The difference is easy to miss when a route planner presents both as an attractive coloured ribbon with a distance beside it. Distance describes the ribbon. The surrounding contour lines describe much of what walking it will demand.
The first useful question to ask of a contour map is where the land is trying to take you. A footpath might follow the side of a valley, climb into a saddle, or cross a succession of small drainage channels. Each of these journeys has a different rhythm, even if the itinerary gives all three the same number of kilometres. Reading the ground around a route gives you a chance to recognise those differences before they matter to a tired group on a wet afternoon.
Start with the legend and one stretch of ground
A contour connects points of equal elevation. The contour interval is the vertical difference between consecutive lines on a given map. You need that interval before trying to judge the relief. You also need the scale, since a millimetre of horizontal separation represents different distances on different maps. The same tight cluster of lines can imply different slopes when the scale or interval changes. Read the legend on the sheet or in the selected layer before comparing two screenshots. Ordnance Survey’s relief and contours guide
Give yourself a real stretch to examine. Pick a section beginning at a clear point, perhaps a bridge or road junction, and ending at a named summit or pass. Work out which direction is uphill by following the elevation labels. Then trace the path between those points with a finger. Notice where it cuts across lines quickly and where it runs roughly parallel to them. A steady crossing of successive lines implies climbing or descending. A length that runs close to the same line implies little net change in elevation along that length, even though the slope beneath your feet might fall away steeply to one side.
This distinction can change a plan. Imagine two paths approaching a ridge, both a kilometre long. One spends most of its length crossing contours on a direct climb. The other traverses beneath the ridge, then turns uphill in a short final section. The second path could feel gentler at first and still involve a demanding finish. That finish matters if you arrive late, if a child has already used most of their energy, or if you need an easy place to reverse course. The map shows where the effort is concentrated.
It helps to translate a few marks into quantities. On a 1:25,000 map, four centimetres represent one kilometre horizontally. If a hypothetical path crosses ten 10-metre intervals in that distance without descending in between, it gains roughly 100 metres over that stretch. But a path that rises 100 metres, drops 60, then rises another 60 has the same net change between endpoints and a different total climb. A profile and a map complement each other here. A profile shows the sequence of rises and falls along your exact line. The map shows the shape of the slopes beside it, where you might turn back or take another public route.
Valleys and spurs can look surprisingly alike
The bend in a contour line helps reveal the landform. In a valley the contours commonly form a bend pointing uphill, toward the head of the channel. On a spur the bend points downslope, following a projection from the higher ground. Check the heights on either side before committing to either interpretation. A series of curves on a clipped screenshot is much easier to misread when no labels, streams or surrounding summits are visible. The mapmaker’s example diagrams are a good starting point because they show the contour pattern alongside the shape it represents. Ordnance Survey’s illustrated exercises
A valley may offer a continuous line to follow, especially if there is a mapped stream. A spur may offer a conspicuous handrail of its own, such as a ridge crest or an edge between slopes. Neither drawing establishes whether walking there is suitable. A valley bottom can be wet or obstructed. A ridge can be windy and exposed. A marked route can cross slopes that look modest from above and feel awkward underfoot. The map provides a terrain hypothesis. The route description, access information, conditions and observations help decide what to do with it.
Take a junction on the side of a long spur. Both options can initially look like paths going uphill. One follows the spur’s spine, while the other swings around its shoulder and descends into a side valley. Look past the first bend. The crossings and the direction of the contour curves can reveal the divergence before the first few metres of either option do. Identifying that distinction in advance gives the group a concrete observation to make instead of an instruction to follow a particular arrow indefinitely.
A saddle is another place where a short stop pays. It lies between higher areas, with lower ground in two other directions. The place can present several apparently plausible ways onward. Identify which slope you expect to climb on leaving it, and which of the valleys you should see off each side if visibility permits. Compare that with the approach you actually walked. This is useful even where signs are good, because the relationship between path and terrain gives you an independent check on which branch of a network a sign refers to.
Turn the map into a sequence of checks
A route becomes easier to reason about when its stages have recognisable endings. Suppose your plan is to leave a stream, climb through woodland, then cross a shallow re-entrant before reaching a saddle. Those are three observations you might be able to make on the ground. The road distance to the saddle tells you little about whether you chose the correct branch in the wood. The order of the landmarks can reveal a problem much sooner.
Write only observations that could actually tell you something. A named summit hidden behind trees may be a poor confirmation point at the junction where you need it. A crossing of a stream can be distinctive if the map shows just one, but less so if there are several minor channels in the same stretch. A change from an uphill traverse to a sharp descent can be a useful signal. If the planned route should continue climbing for another half kilometre, the descent is a reason to check position and direction while returning to the last known point is still easy.
For a practice walk, compare the map and terrain at a place you already know. A park, a road on a hill or a valley seen from a public viewpoint is enough. Start by predicting where a route will climb most sharply, then look for the change on the ground. Reverse the exercise and describe a slope before finding its contours. It is particularly instructive to do this in a place whose paths you normally walk without thinking. Familiarity can free up attention for the visual comparison instead of the pressure of finding a destination.
A group can share the job without turning the outing into a lesson. One person describes the next landmark and another checks it independently. At a pause, they compare the ground with the plan and note any disagreement. That habit is useful when the person holding the phone is concentrating on a dot and somebody else can see that the expected wall or stream is missing. British Mountaineering Council’s navigation resources present map basics as skills to practise, including reading how contour shape and spacing represent terrain. British Mountaineering Council navigation guidance
Make decisions about the walk, not just the line
Consider a hypothetical group travelling on a short winter day. Their circular route has a difficult section on the far side of a ridge and an easier descent from a junction before the ridge. They agree to decide at that junction whether to continue. Reading the contours shows that the alternative descent drops in stages, with a short steep part first. This matters because the group might otherwise treat that branch as automatically easy simply because it goes downhill. A meaningful fallback is one they have examined with the same care as the intended route.
The same logic applies to time estimates. A route plan might give an overall duration, but it cannot know how carefully your companions descend a rough slope or how often they stop. Separate the times you are willing to spend climbing, crossing exposed ground and descending before darkness. Check the actual progress against those assumptions at a place where a change is still easy. An early slow climb may tell you more about the rest of the outing than the remaining distance displayed by a device.
Remember the space that the map cannot show at its chosen interval. A short bank, drainage cut or step can be significant for an individual walker and too small to leave a useful contour signature. A broad, gentle-looking route may have awkward short sections, gates or a surface that becomes difficult after rain. A path on the map is also a poor substitute for checking the applicable access arrangements. Current local notices and the official route description can answer questions that a topographic layer was never meant to settle.
Orientation is a different problem again. A promising pattern of lines has little value if you have matched it to the wrong valley. Compare the direction of the valley or ridge with the map, then check another feature independently. When visibility is limited, a familiar shape from a photograph may disappear and several nearby slopes may seem equally plausible. Practise navigation on forgiving terrain and seek appropriate instruction before relying on these skills in unfamiliar or demanding conditions.
What to keep when the screen goes away
A route can be transferred to a device and still benefit from some work on paper. Keep the scale and legend with any printed extract. Include enough surrounding ground to recognise adjacent valleys and roads, and enough of the planned alternatives to make them usable if the original path is unavailable. If you rely on a digital map, confirm the required map detail is available away from a connection. An exported track with no surrounding detail preserves a path to follow while leaving out much of the evidence needed to check it.
The important margin is room for a decision. Put your pause before the exposed stretch, while the terrain still offers a usable alternative. On the map, identify a feature that tells you that you have reached that pause. On the walk, use it to compare the time, the group and the observed conditions with the plan. If the route changes, the map still has a job. It gives you ways to understand how the alternative fits into the surrounding land.
Try returning to that first line on the map after the walk. Mark the place where the real effort began and where the terrain surprised you. Was the surprise a misunderstanding of the scale, an unmapped surface problem, or a decision to take a different line? Those are three different lessons. A walker who can distinguish them has learned something more durable than a good or bad rating for a single outing. The next time a route appears as a ribbon on a screen, the land on either side will already be part of the journey.